Nano Table
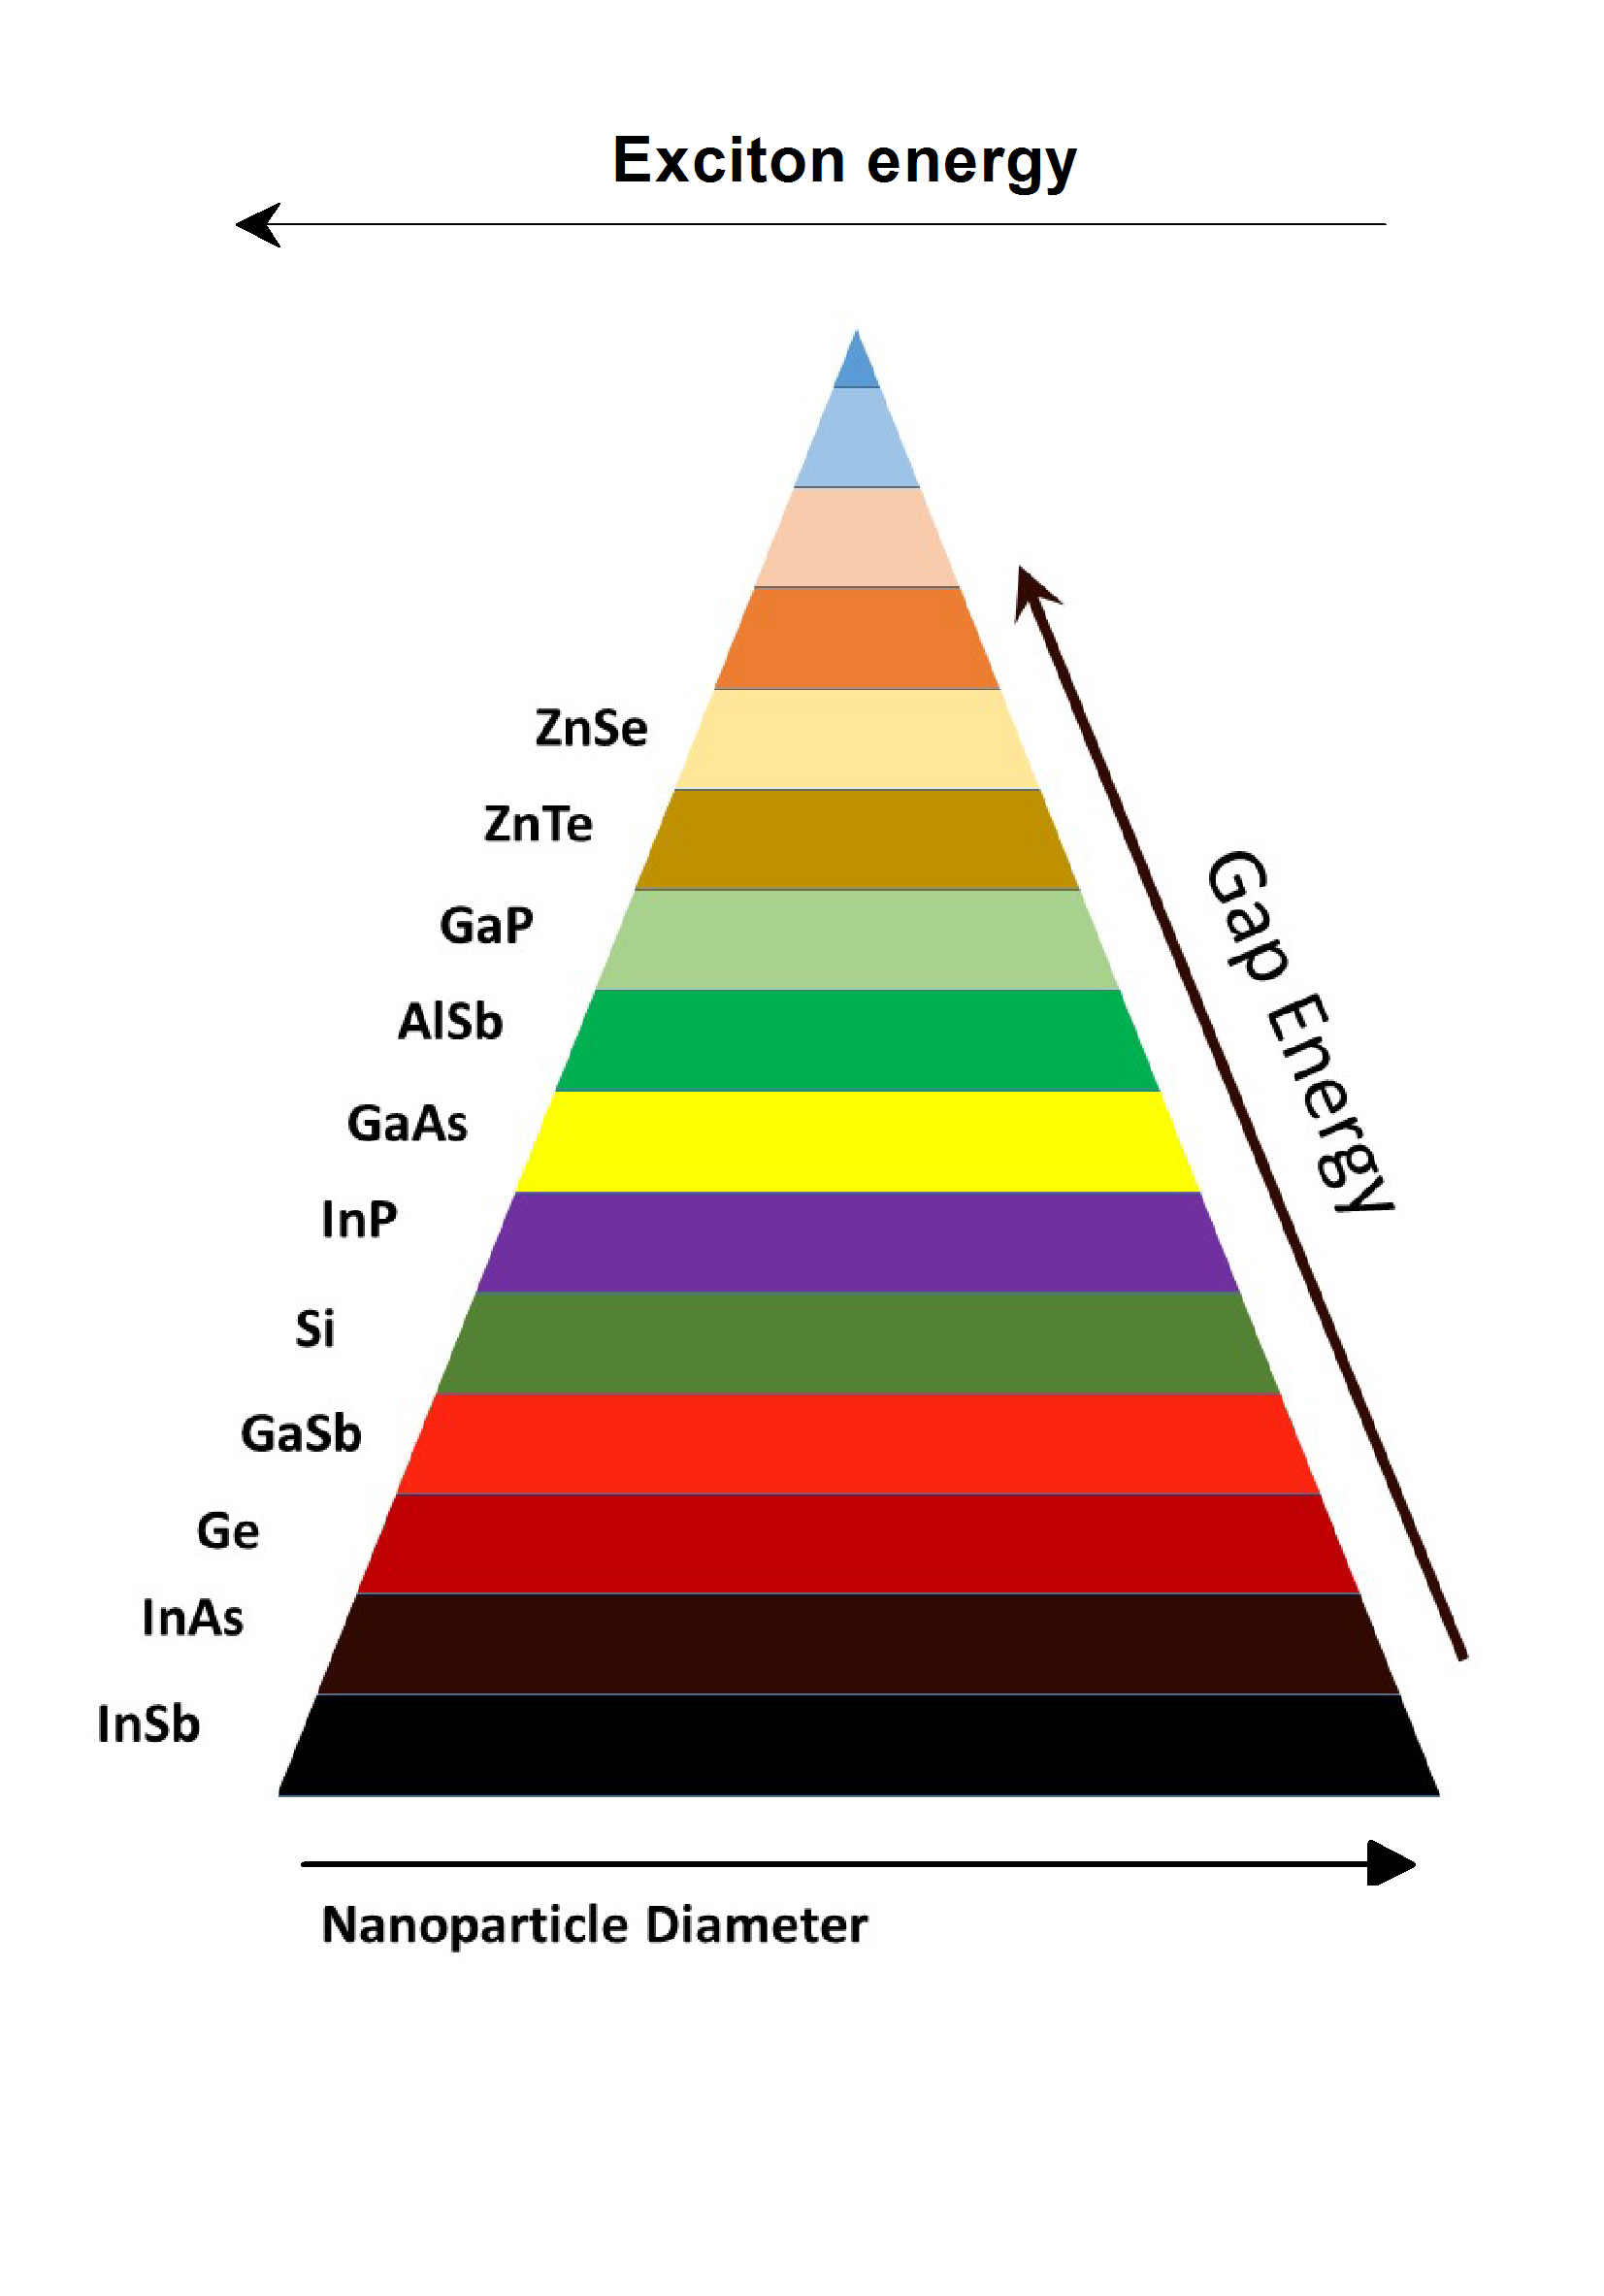
By Guillermo Muñoz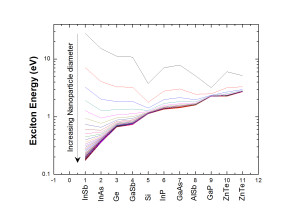 Here it is shown in a clearer way the evolution of the excitonic energy for each material as particle sizes increase. All lines tend to the large particle limit, where nanotechnology effects (quantum confinement, in this case) don’t apply. In my imagination, the area between the top line (corresponding to the small particles) and the limit case (bulk limit), corresponds to a visualization of the quantum confinement for semiconductor nanoparticles. It seemed to me a triangle, and I just plotted the following arrangement:
Thursday, 07/23/2015
 (3D Periodic Table. Michael Aldersley)
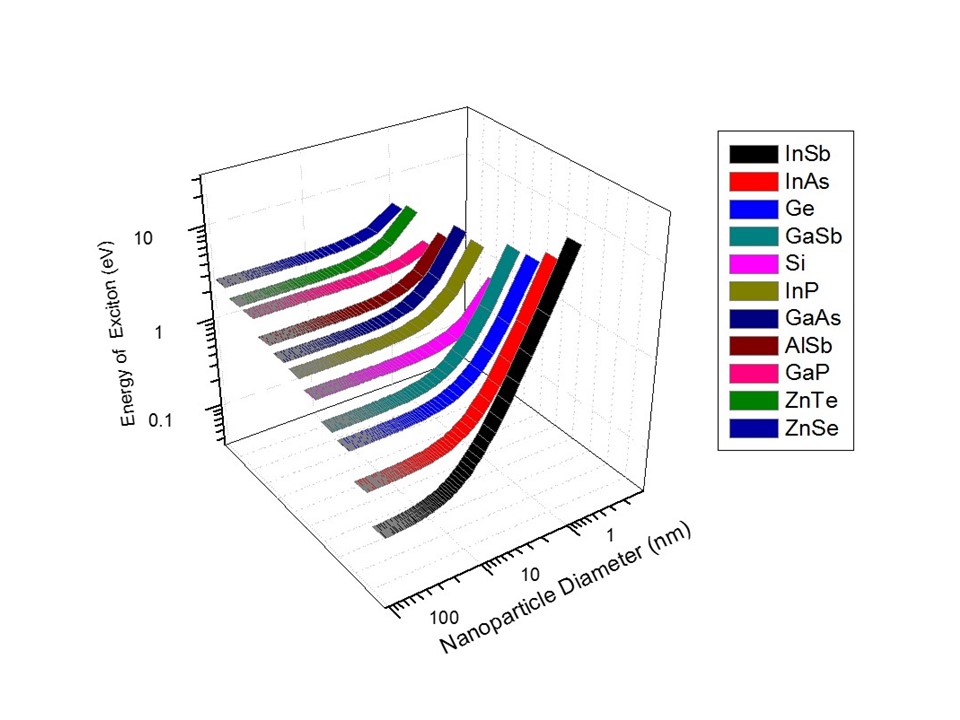
 Here it is shown in a clearer way the evolution of the excitonic energy for each material as particle sizes increase. All lines tend to the large particle limit, where nanotechnology effects (quantum confinement, in this case) don’t apply. In my imagination, the area between the top line (corresponding to the small particles) and the limit case (bulk limit), corresponds to a visualization of the quantum confinement for semiconductor nanoparticles. It seemed to me a triangle, and I just plotted the following arrangement: